Sustainability in numbers
The Stena Group has a decentralised governance model where each company is responsible for its own goals and results. Here is a selection of the Group’s key figures for 2024 within its four focus areas.
Environment
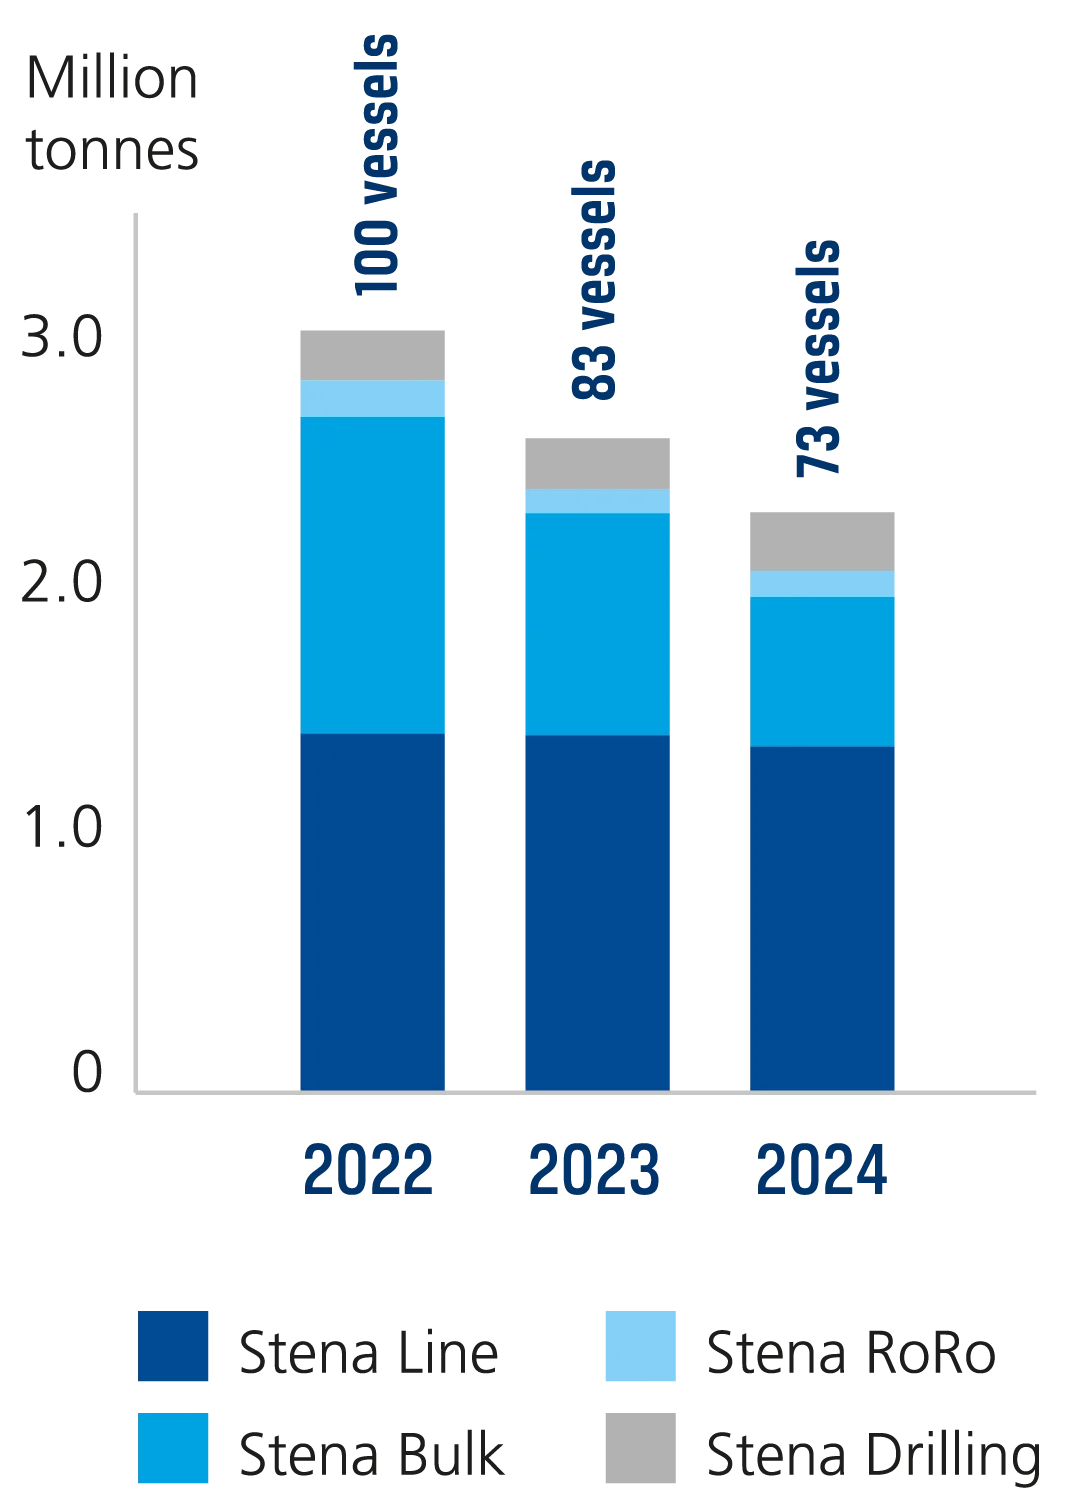
Carbon emissions in million tonnes
Total carbon emissions from the Group’s vessels by business unit. In 2024, Stena reduced its emissions due to a reduced fleet. This meant that total emissions from vessels decreased by approximately 11% compared with 2023.
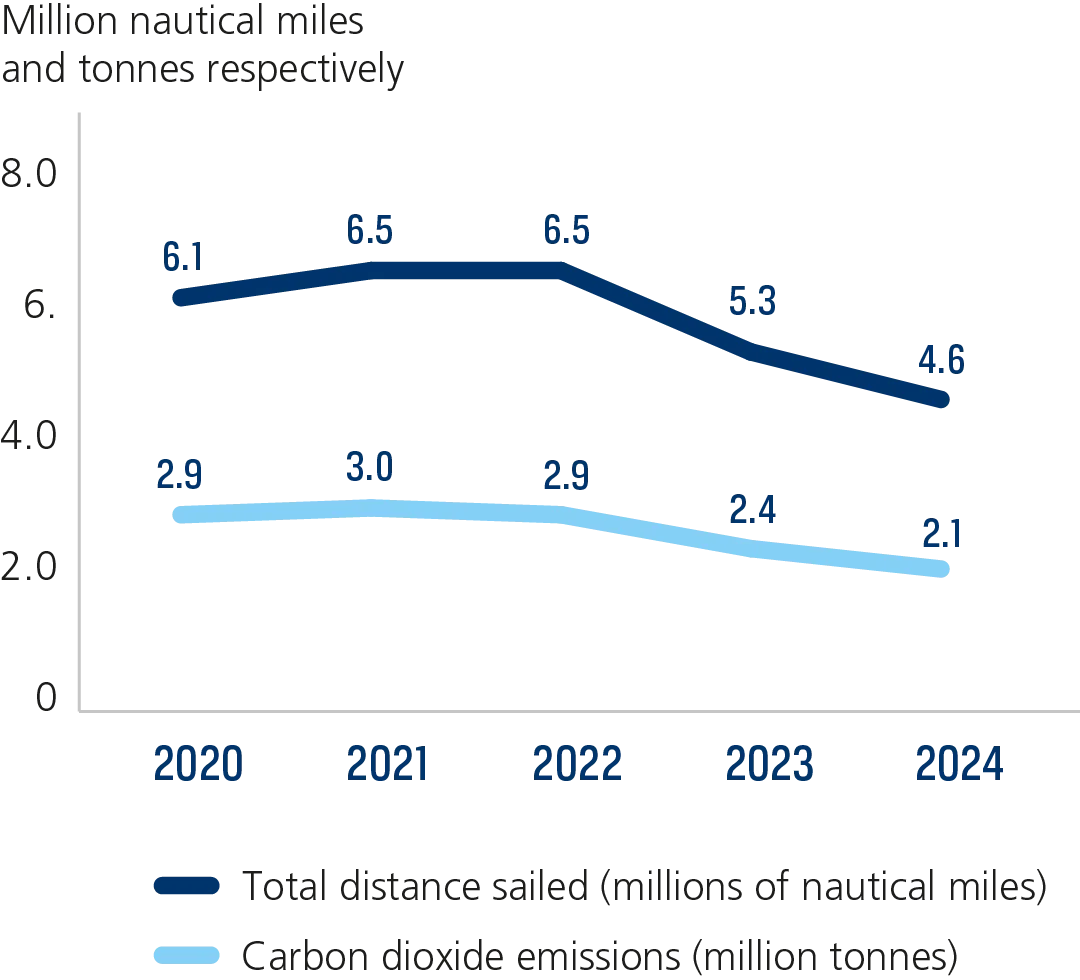
Nautical miles sailed and carbon emissions respectively
Carbon emissions from the Group’s vessels* and distance sailed. Both carbon emissions and distance sailed decreased during the year.
*Stena Line, Stena RoRo and Stena Bulk.
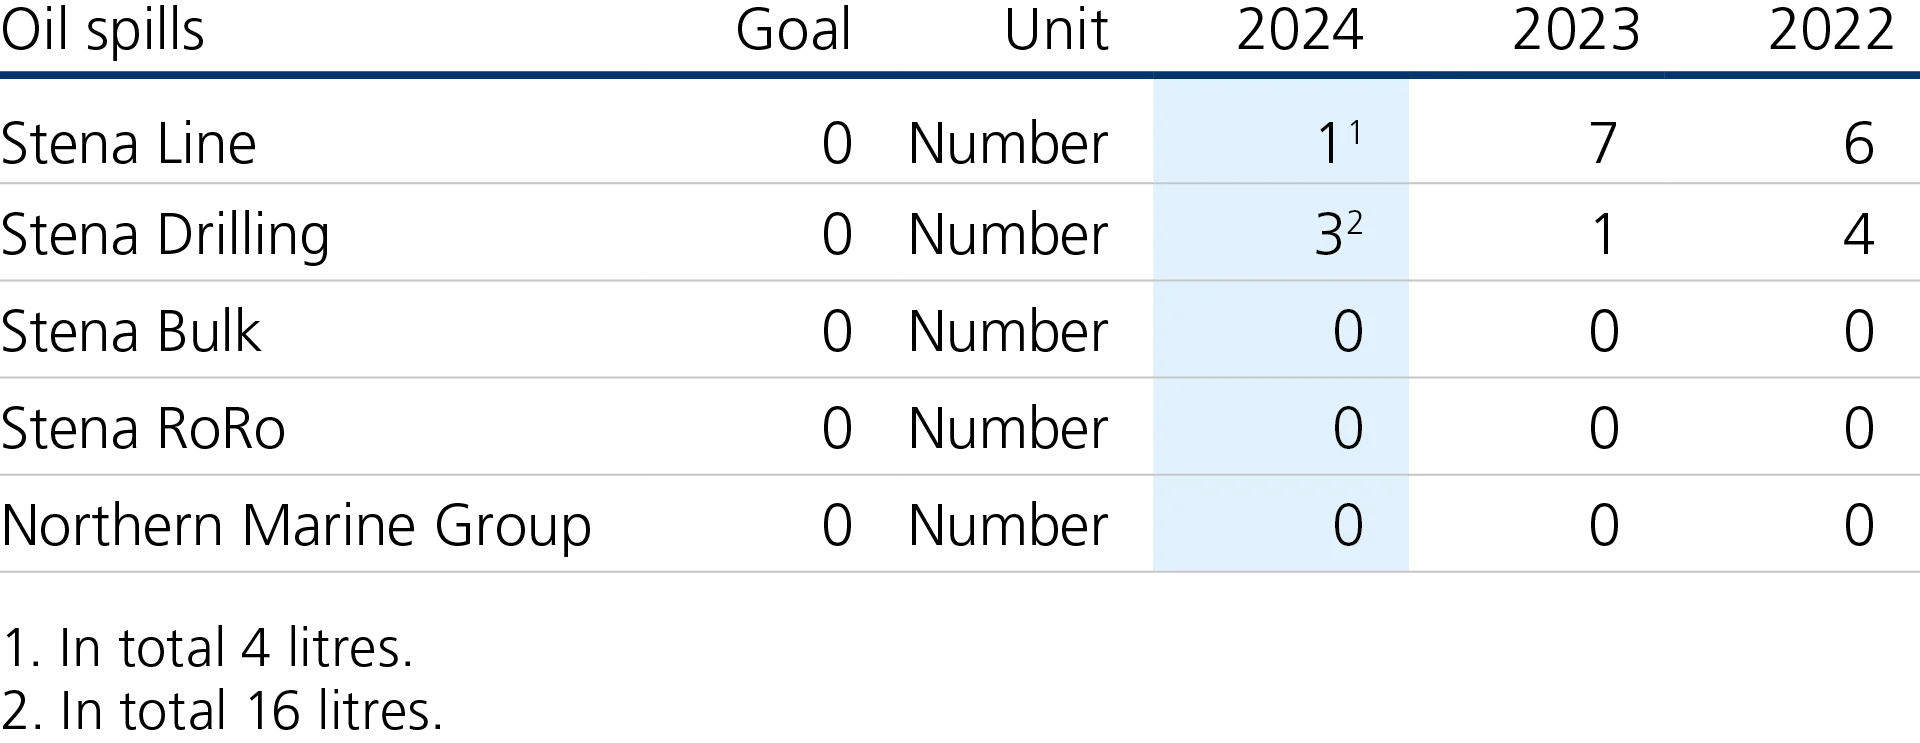
Oil spills
The total number of oil spills during the year resulted in spills of 20 litres.
Society
18,000
Number of employees across the whole group
This figure includes external seagoing employees via Northern Marine Group.
346
Homes produced, Stena Property
The projects completed during the year were in Askim, Haninge and Fisksätra.
20
Number of ferry routes*, Stena Line
*Including Africa Morocco Link (AML).
4.6
Million nautical miles for Stena Line, Stena Bulk and stena RoRo
Together, the companies transported passengers and essential products approx. 215 times around the world.
Safety & Security
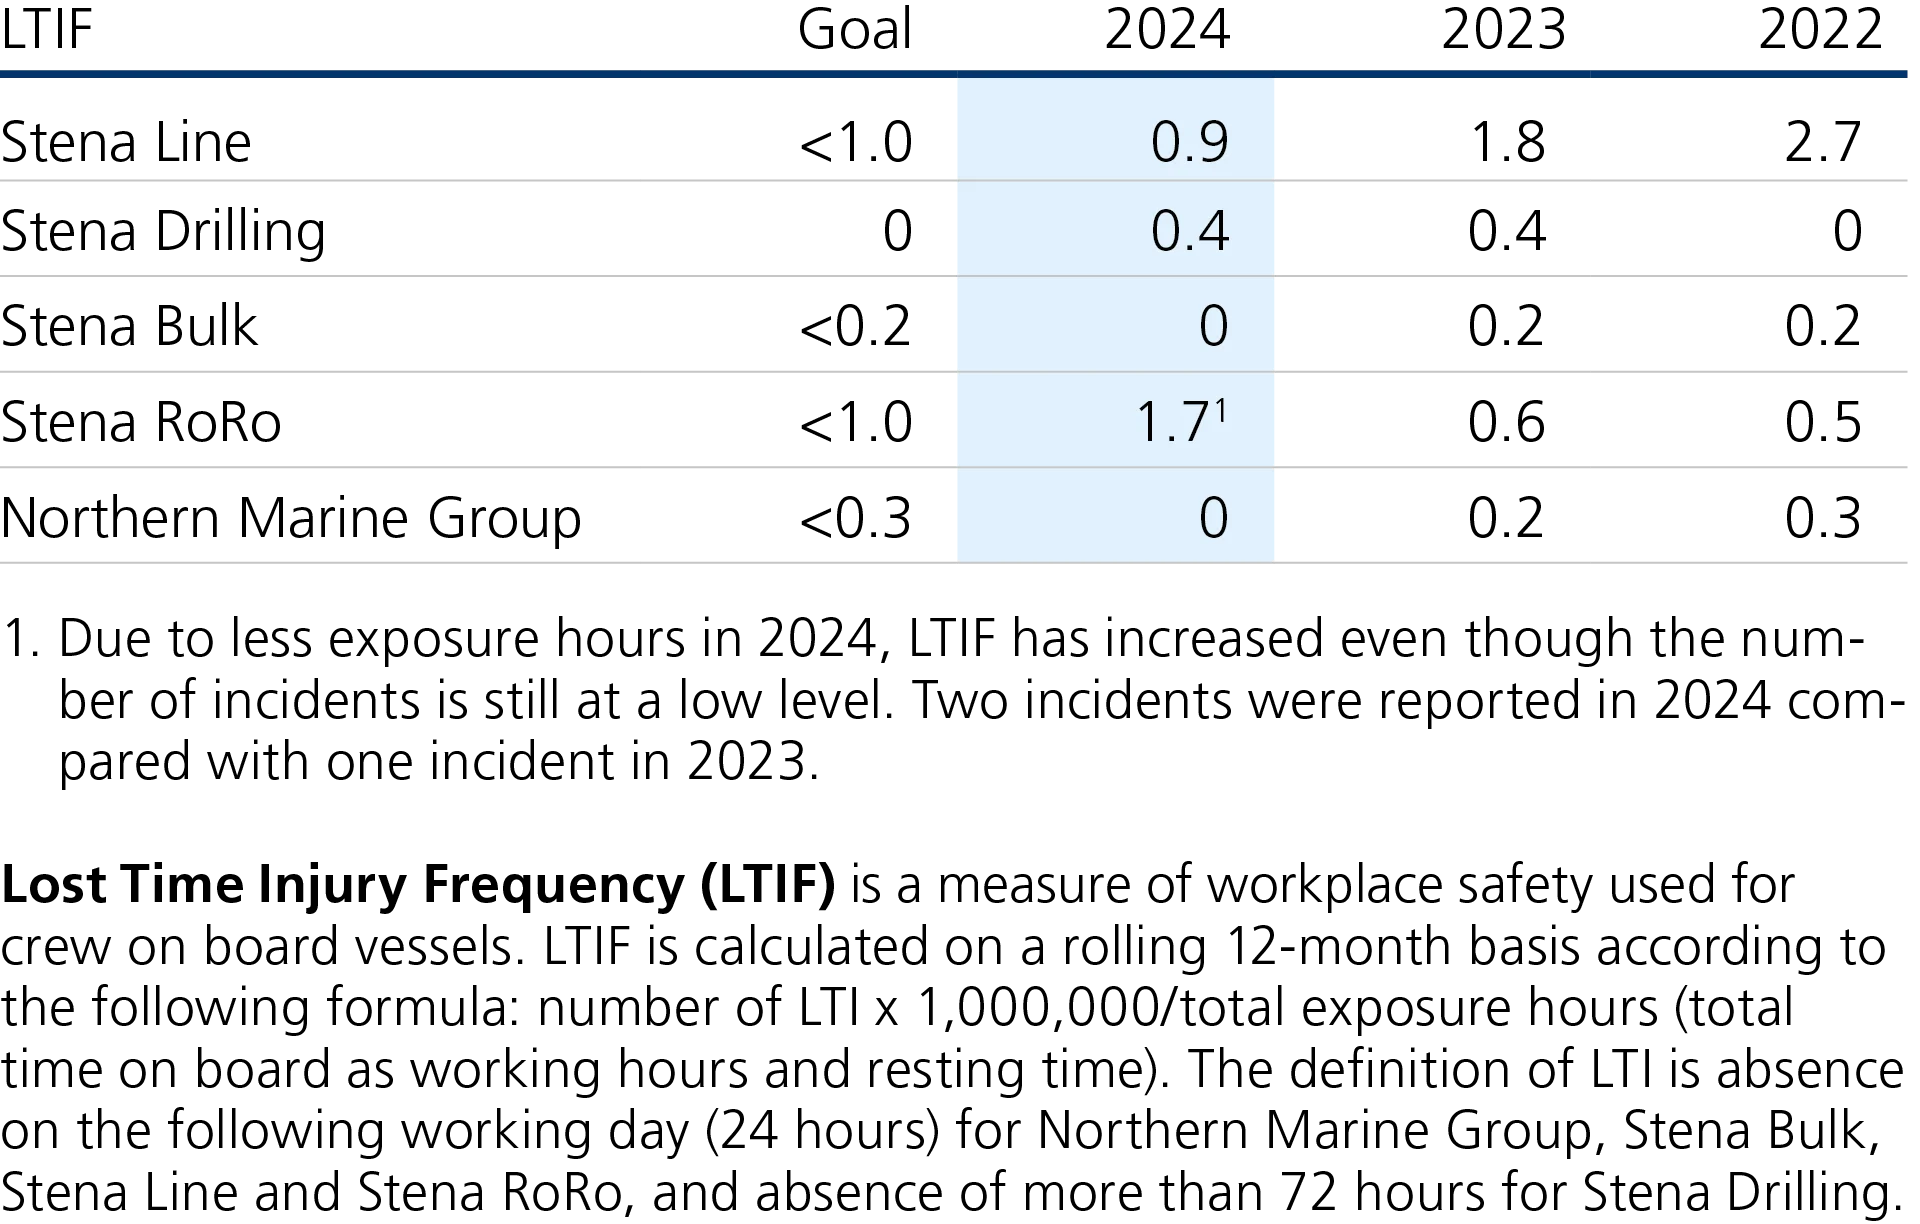
LTIF
Safety is one of the first items on the agenda at all Board meetings in the maritime business units. LTIF is an important metric for this safety aspect.
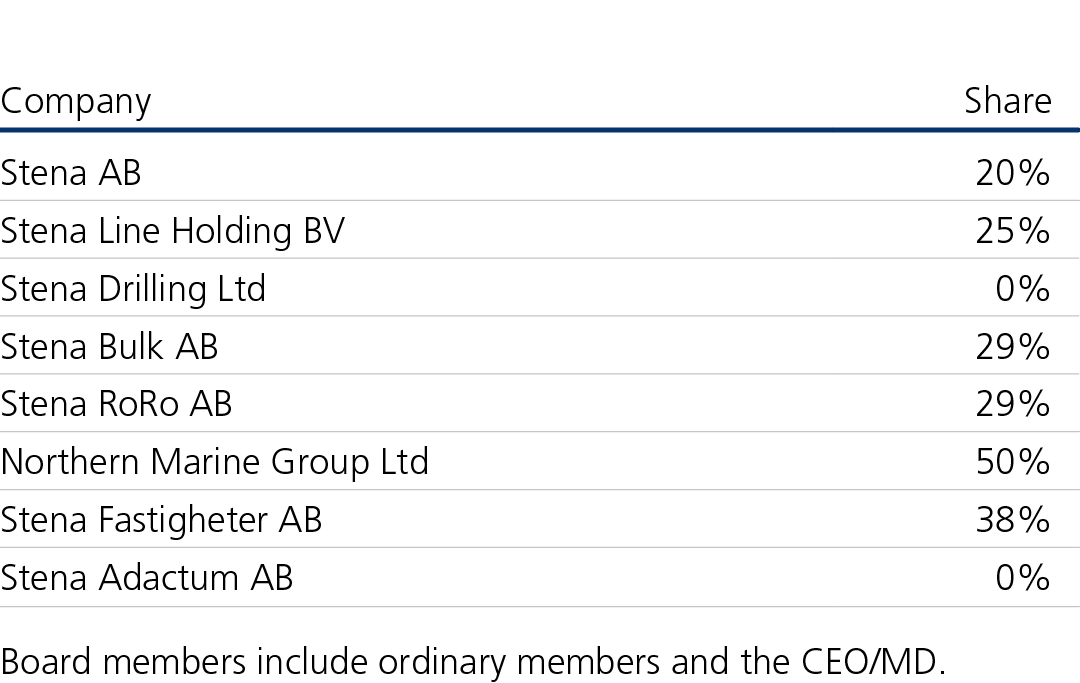
People
Women on Boards of Directors
Stena’s long-term goal is to achieve gender equality on Boards of Directors (40–60%).